Views
Views are the building blocks for monitoring data and building insights. With charts and summary statistics, they map the measurements generated by your monitoring system against guidelines of specific interest. Each project has its own set of views. To access them, click Views in the main menu.
The Views page lists all Views that are part of the current project.
General
Select period
All views include a Period dropdown in the page subheader. You can select one of the predefined periods (e.g. last 7 days, last 30 days) or define a custom date range with a start and end date.
Edit a View
To edit the View, click the Edit button in the page header, at the top right of the page.
Add a View
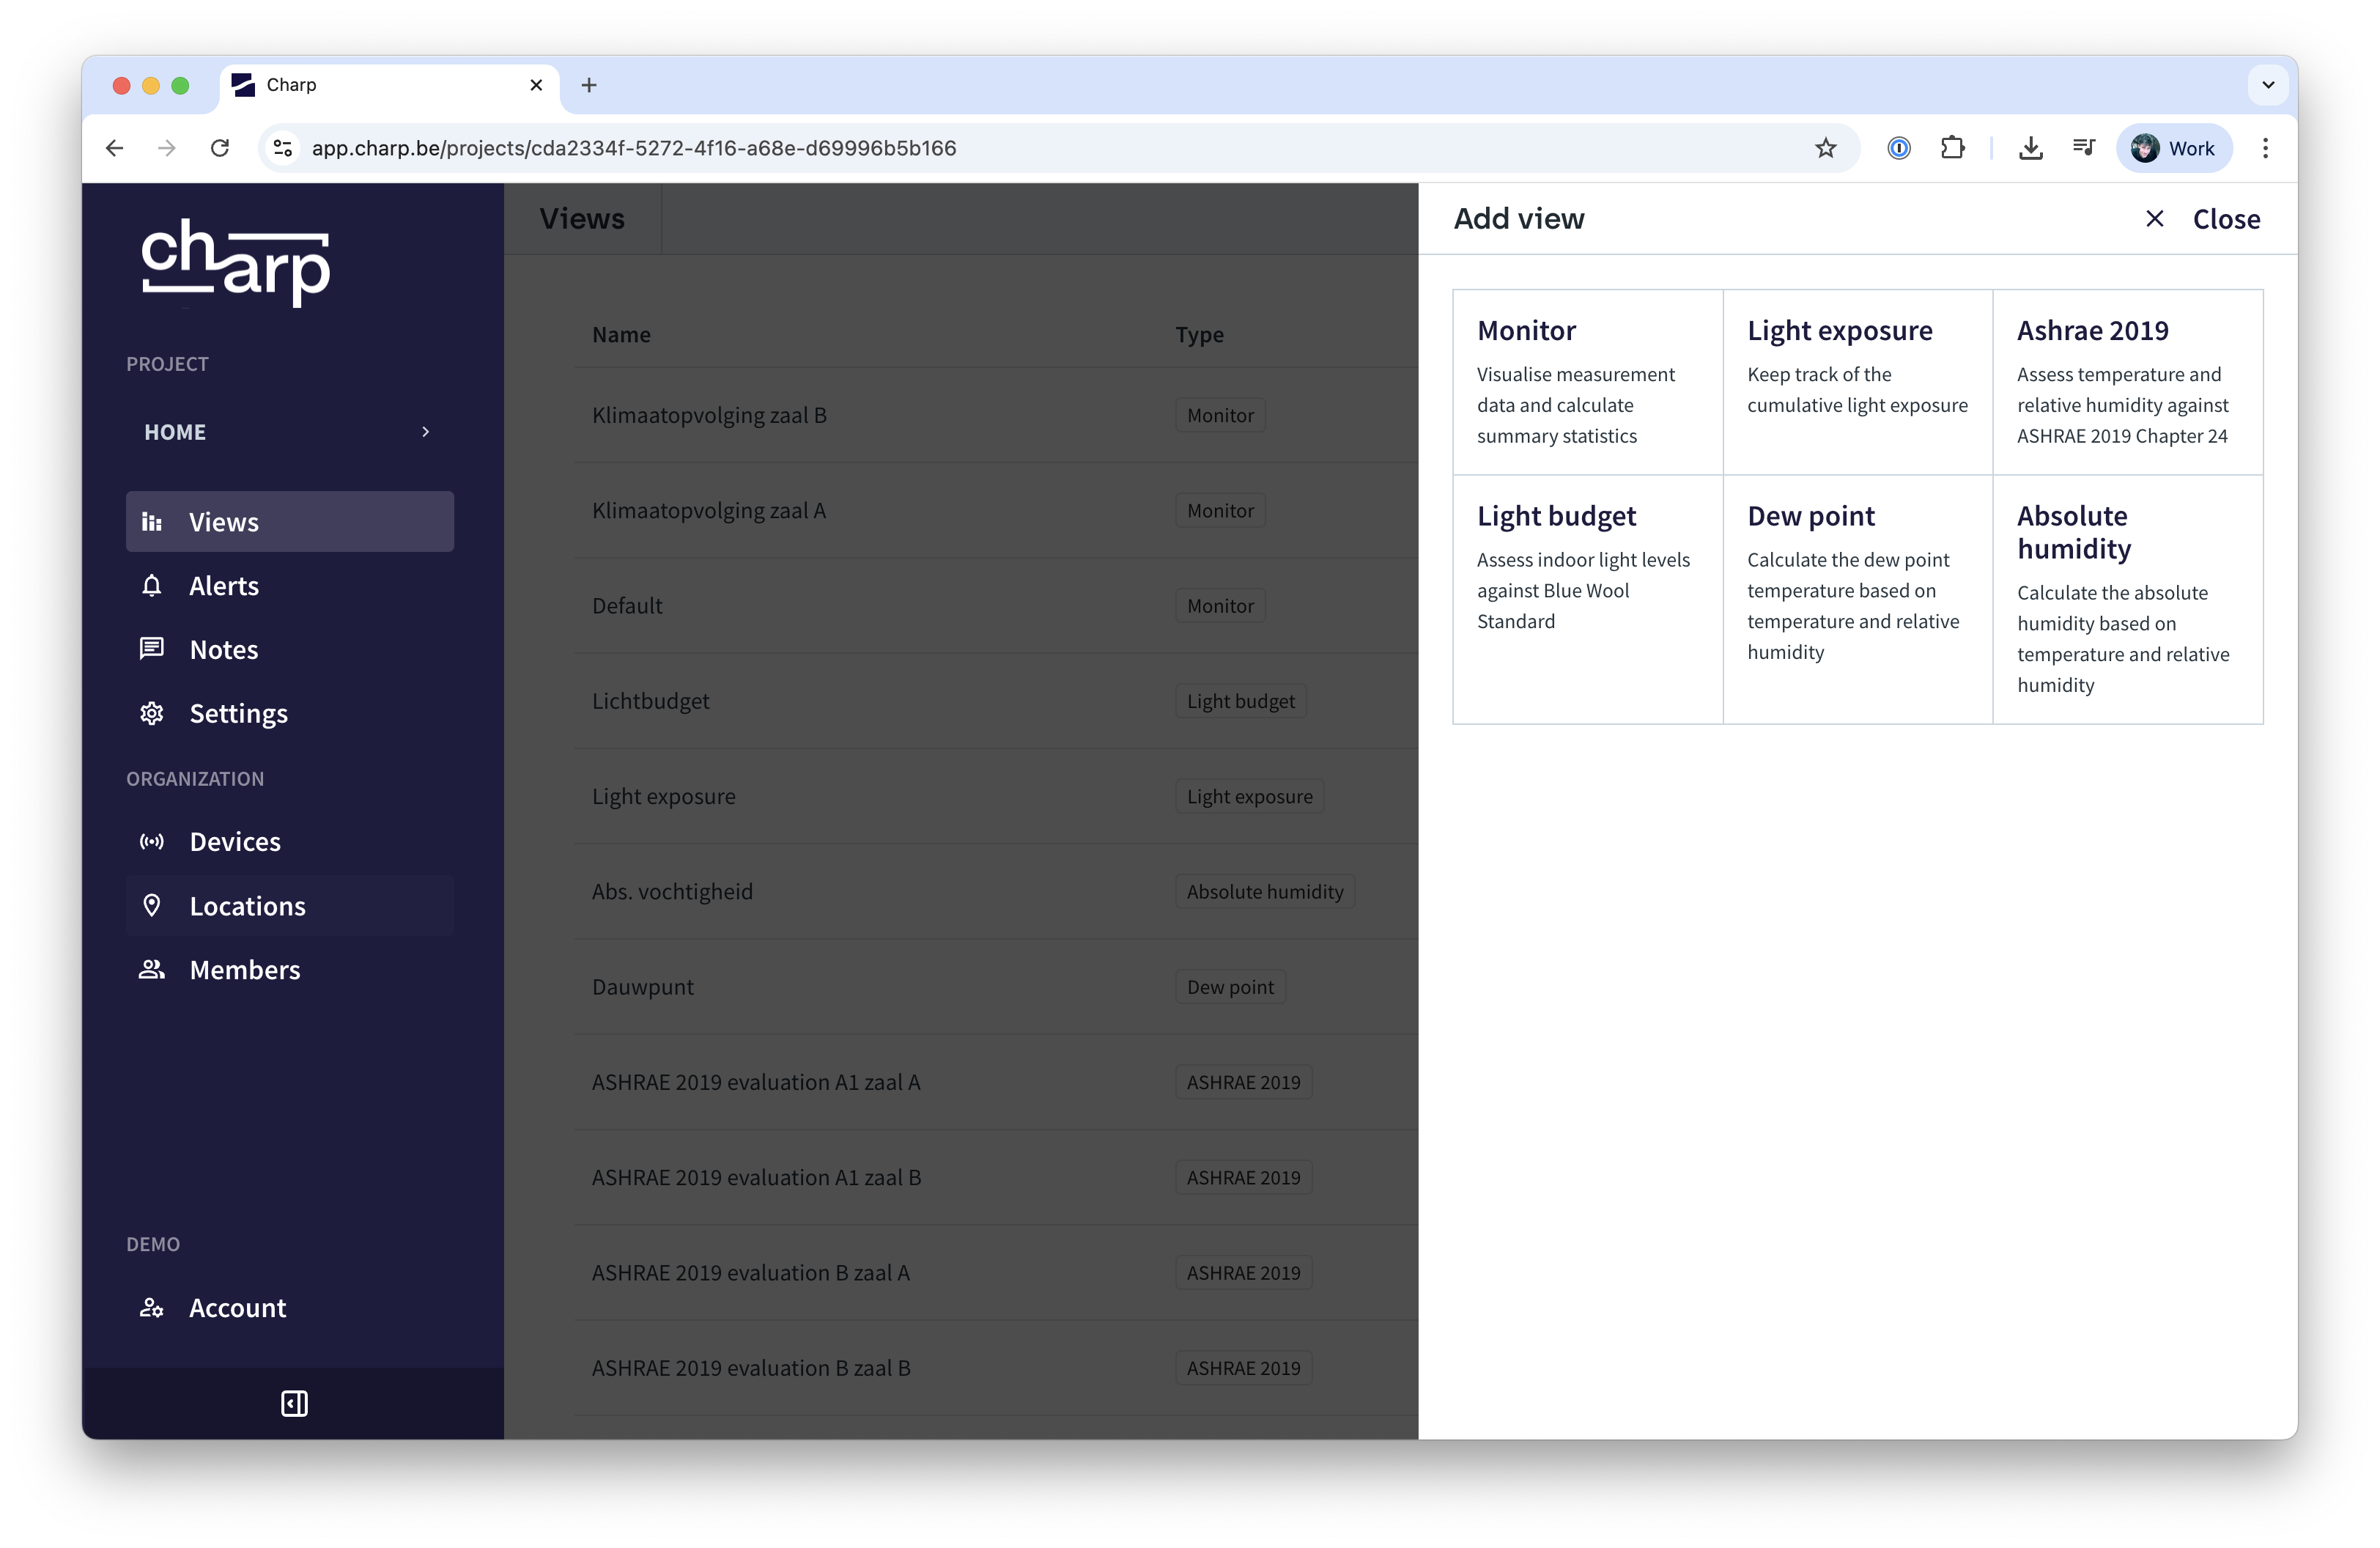
To create a new View, click the + Add View button in the page header, at the top right of the page.
The following views are available:
- Monitor — explore real-time and historical sensor data
- Dew point — calculate and visualise dew point from temperature and relative humidity
- Absolute humidity — monitor absolute humidity levels
- ASHRAE 2019 — evaluate climate conditions against ASHRAE 2019 guidelines
- Light exposure — track cumulative light exposure in lux.hours
- Light budget — compare cumulative exposure against conservation targets
Print to PDF
Clicking the printer icon in the page header menu at the top right generates a PDF version of the current view. This allows you to share visualisations and insights, e.g. with external partners, without giving direct access.
Monitor view
The Monitor view displays sensor data in a combined chart and table format. The chart plots time series data with time on the x-axis and the measured metric on the y-axis. Summary statistics (median, mean, minimum, maximum, and standard deviation) are collected in the table below the chart.
For each measurement type (e.g. temperature, relative humidity, ...), a separate chart is generated. The charts are stacked and share a single datetime x-axis.
Zoom in and out
Zoom in on a specific time range by clicking and dragging across the chart. Double-click to reset the zoom and return to the full period (as selected in the page header).
Take a note on the chart
By default, clicking and dragging on the chart areas allow to zoom in and out on specific periods of the data. To take a note directly on the chart, at a given moment or during a specific period, enable note-taking by switching on the Notes toggle, located at the top right of the chart.
After enabling note taking, click or click-and-drag on the chart to select a moment in time or a period on which you wish to take a note. The drawer that appears from the right takes the selected period into account. For more precise handling, you can still fine-tune the start and end date, as you would for any note.
After submitting, the created note appears on the charts as a vertical line and a visual mark at the bottom of the chart, along the x-axis.
Light exposure view
The Light exposure view calculates the cumulative light exposure in lux.hours based on lux measurements from your light sensors.
Adding a light exposure view
- Click + Add View
- Select Light exposure
- Enter a name for the view
- Select the locations to include
- Confirm to create the view
View structure
The overview table shows, for each selected light sensor:
- Cumulative sum — total lux.hours over the selected period
- Mean — average lux level
- 95th percentile — the highest light level after removing the top 5% of measurements
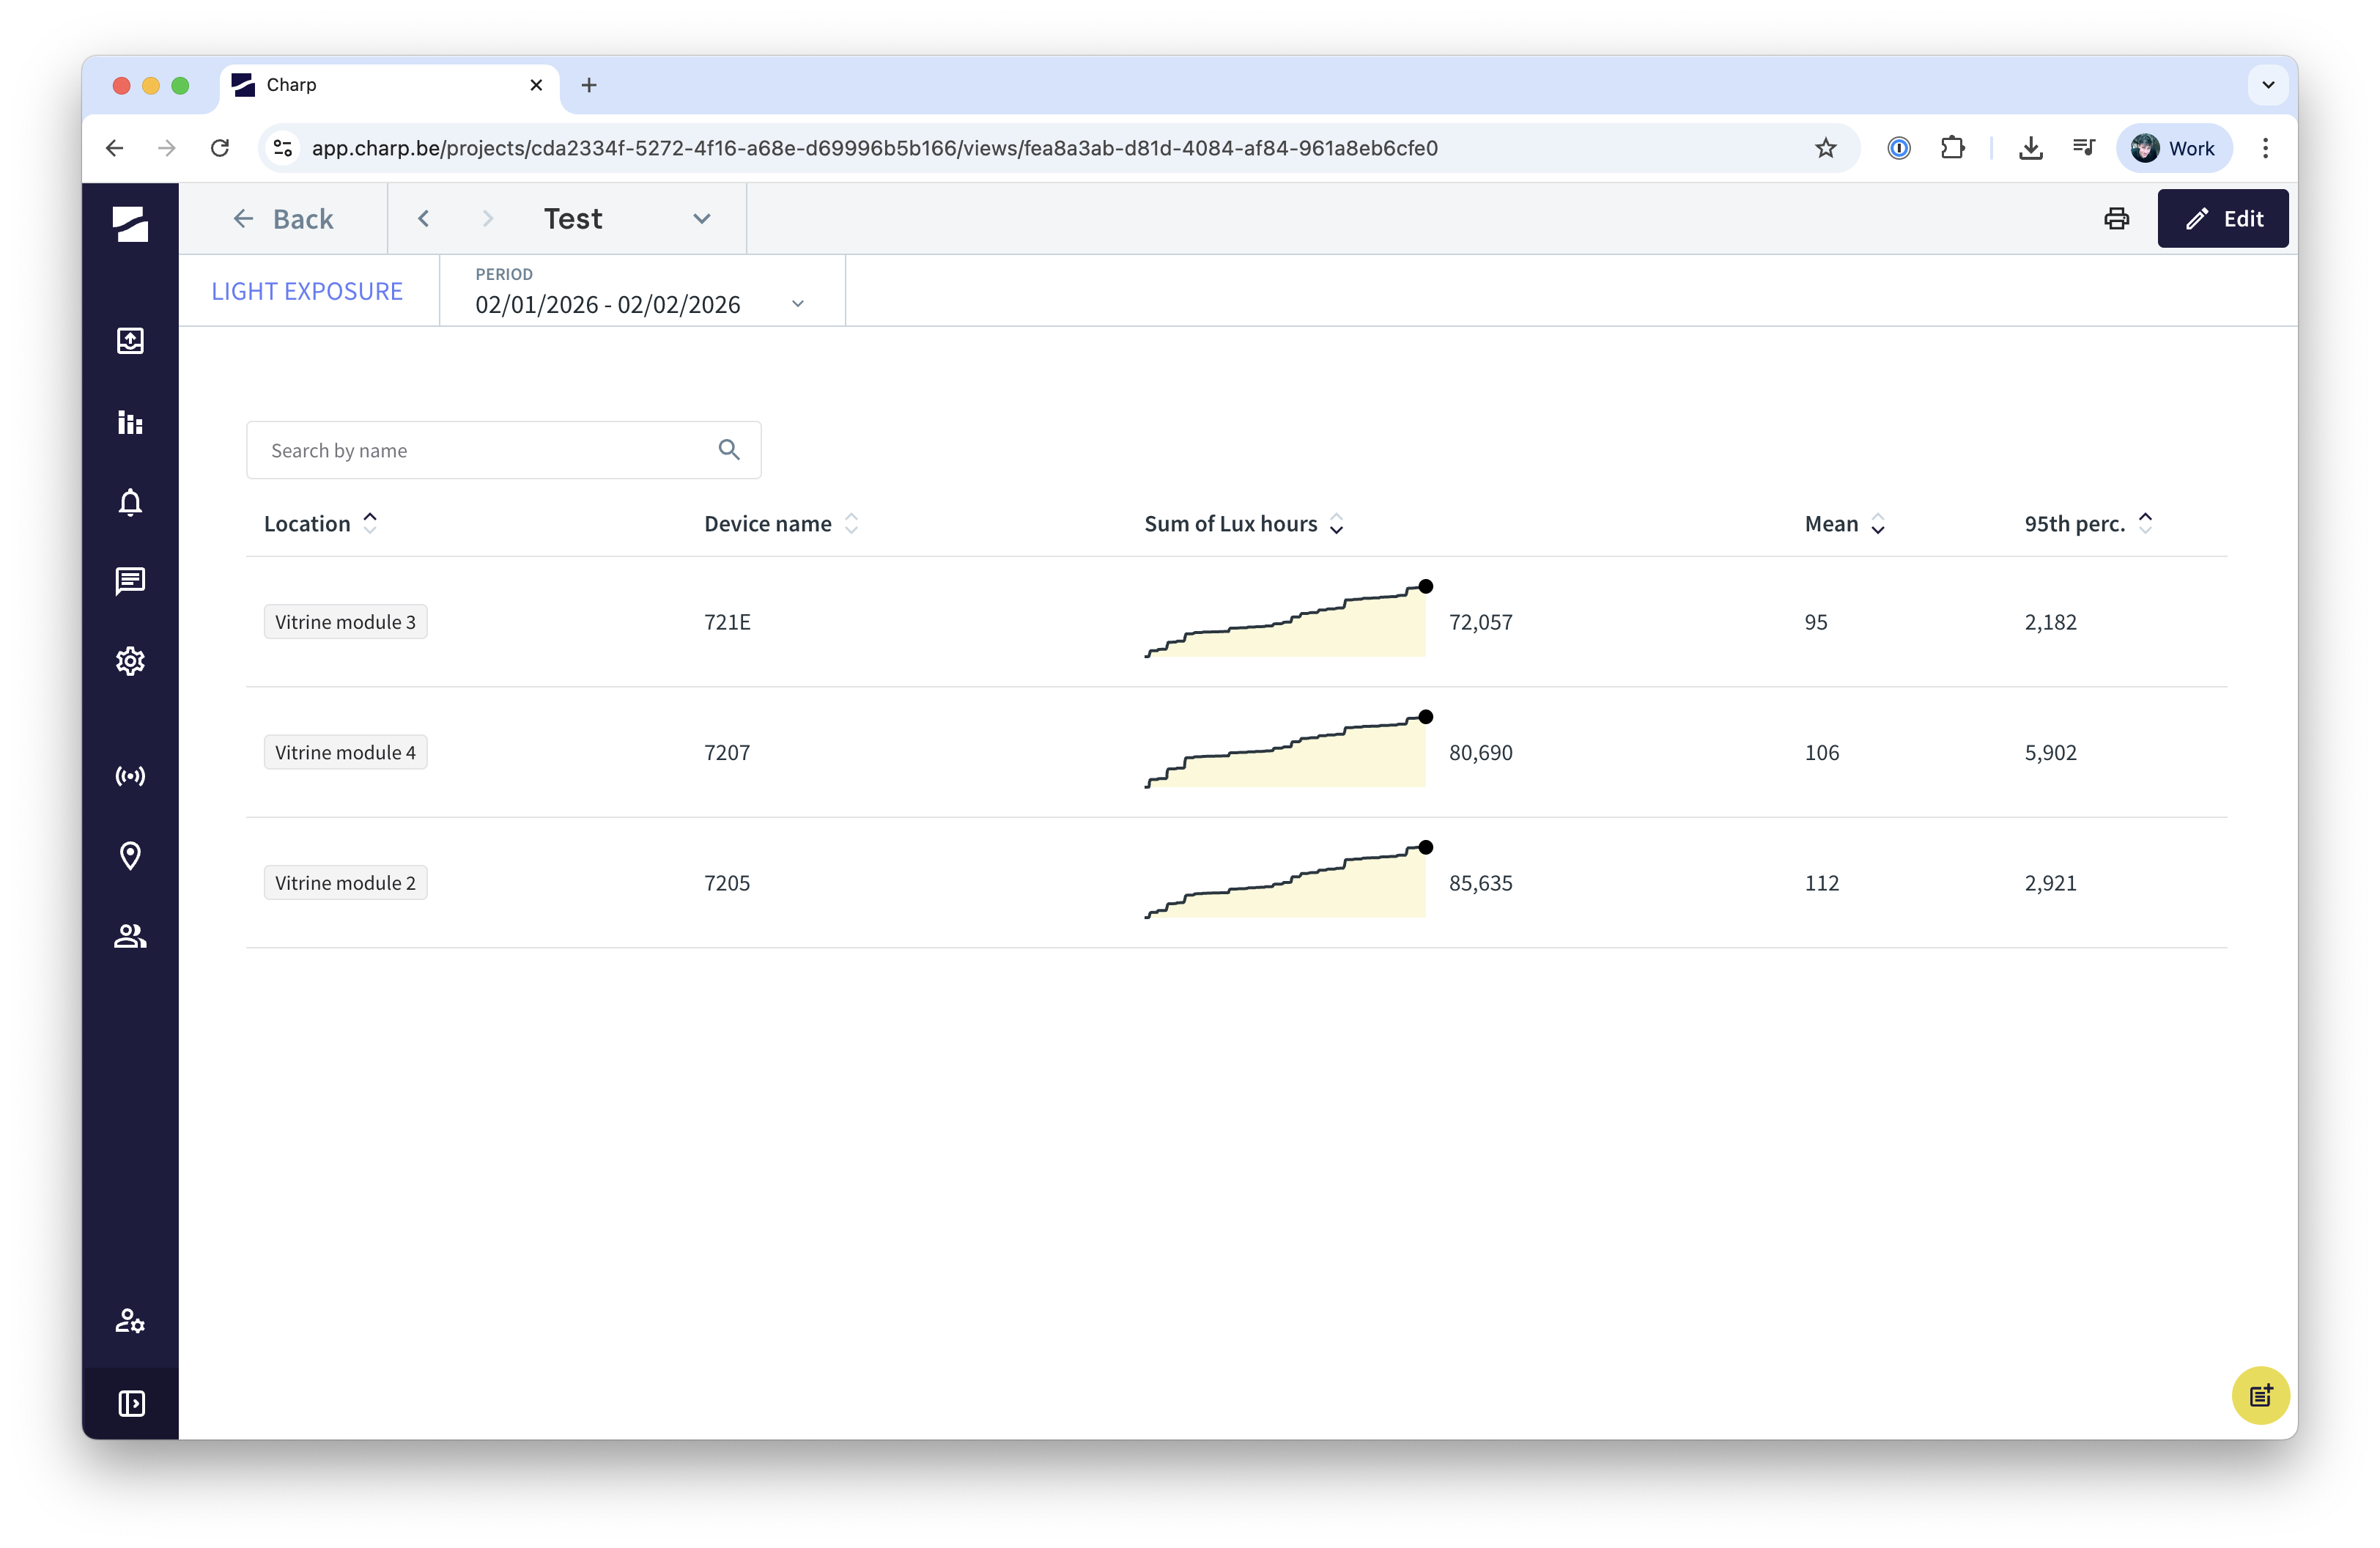
The 95th percentile indicates the highest light level remaining after the top 5% of measured light levels are removed. This measure is used instead of the maximum to avoid a biased view on peak light levels during normal operation — occasional spikes (e.g. from a door opening or a torch) are excluded.
Detail view
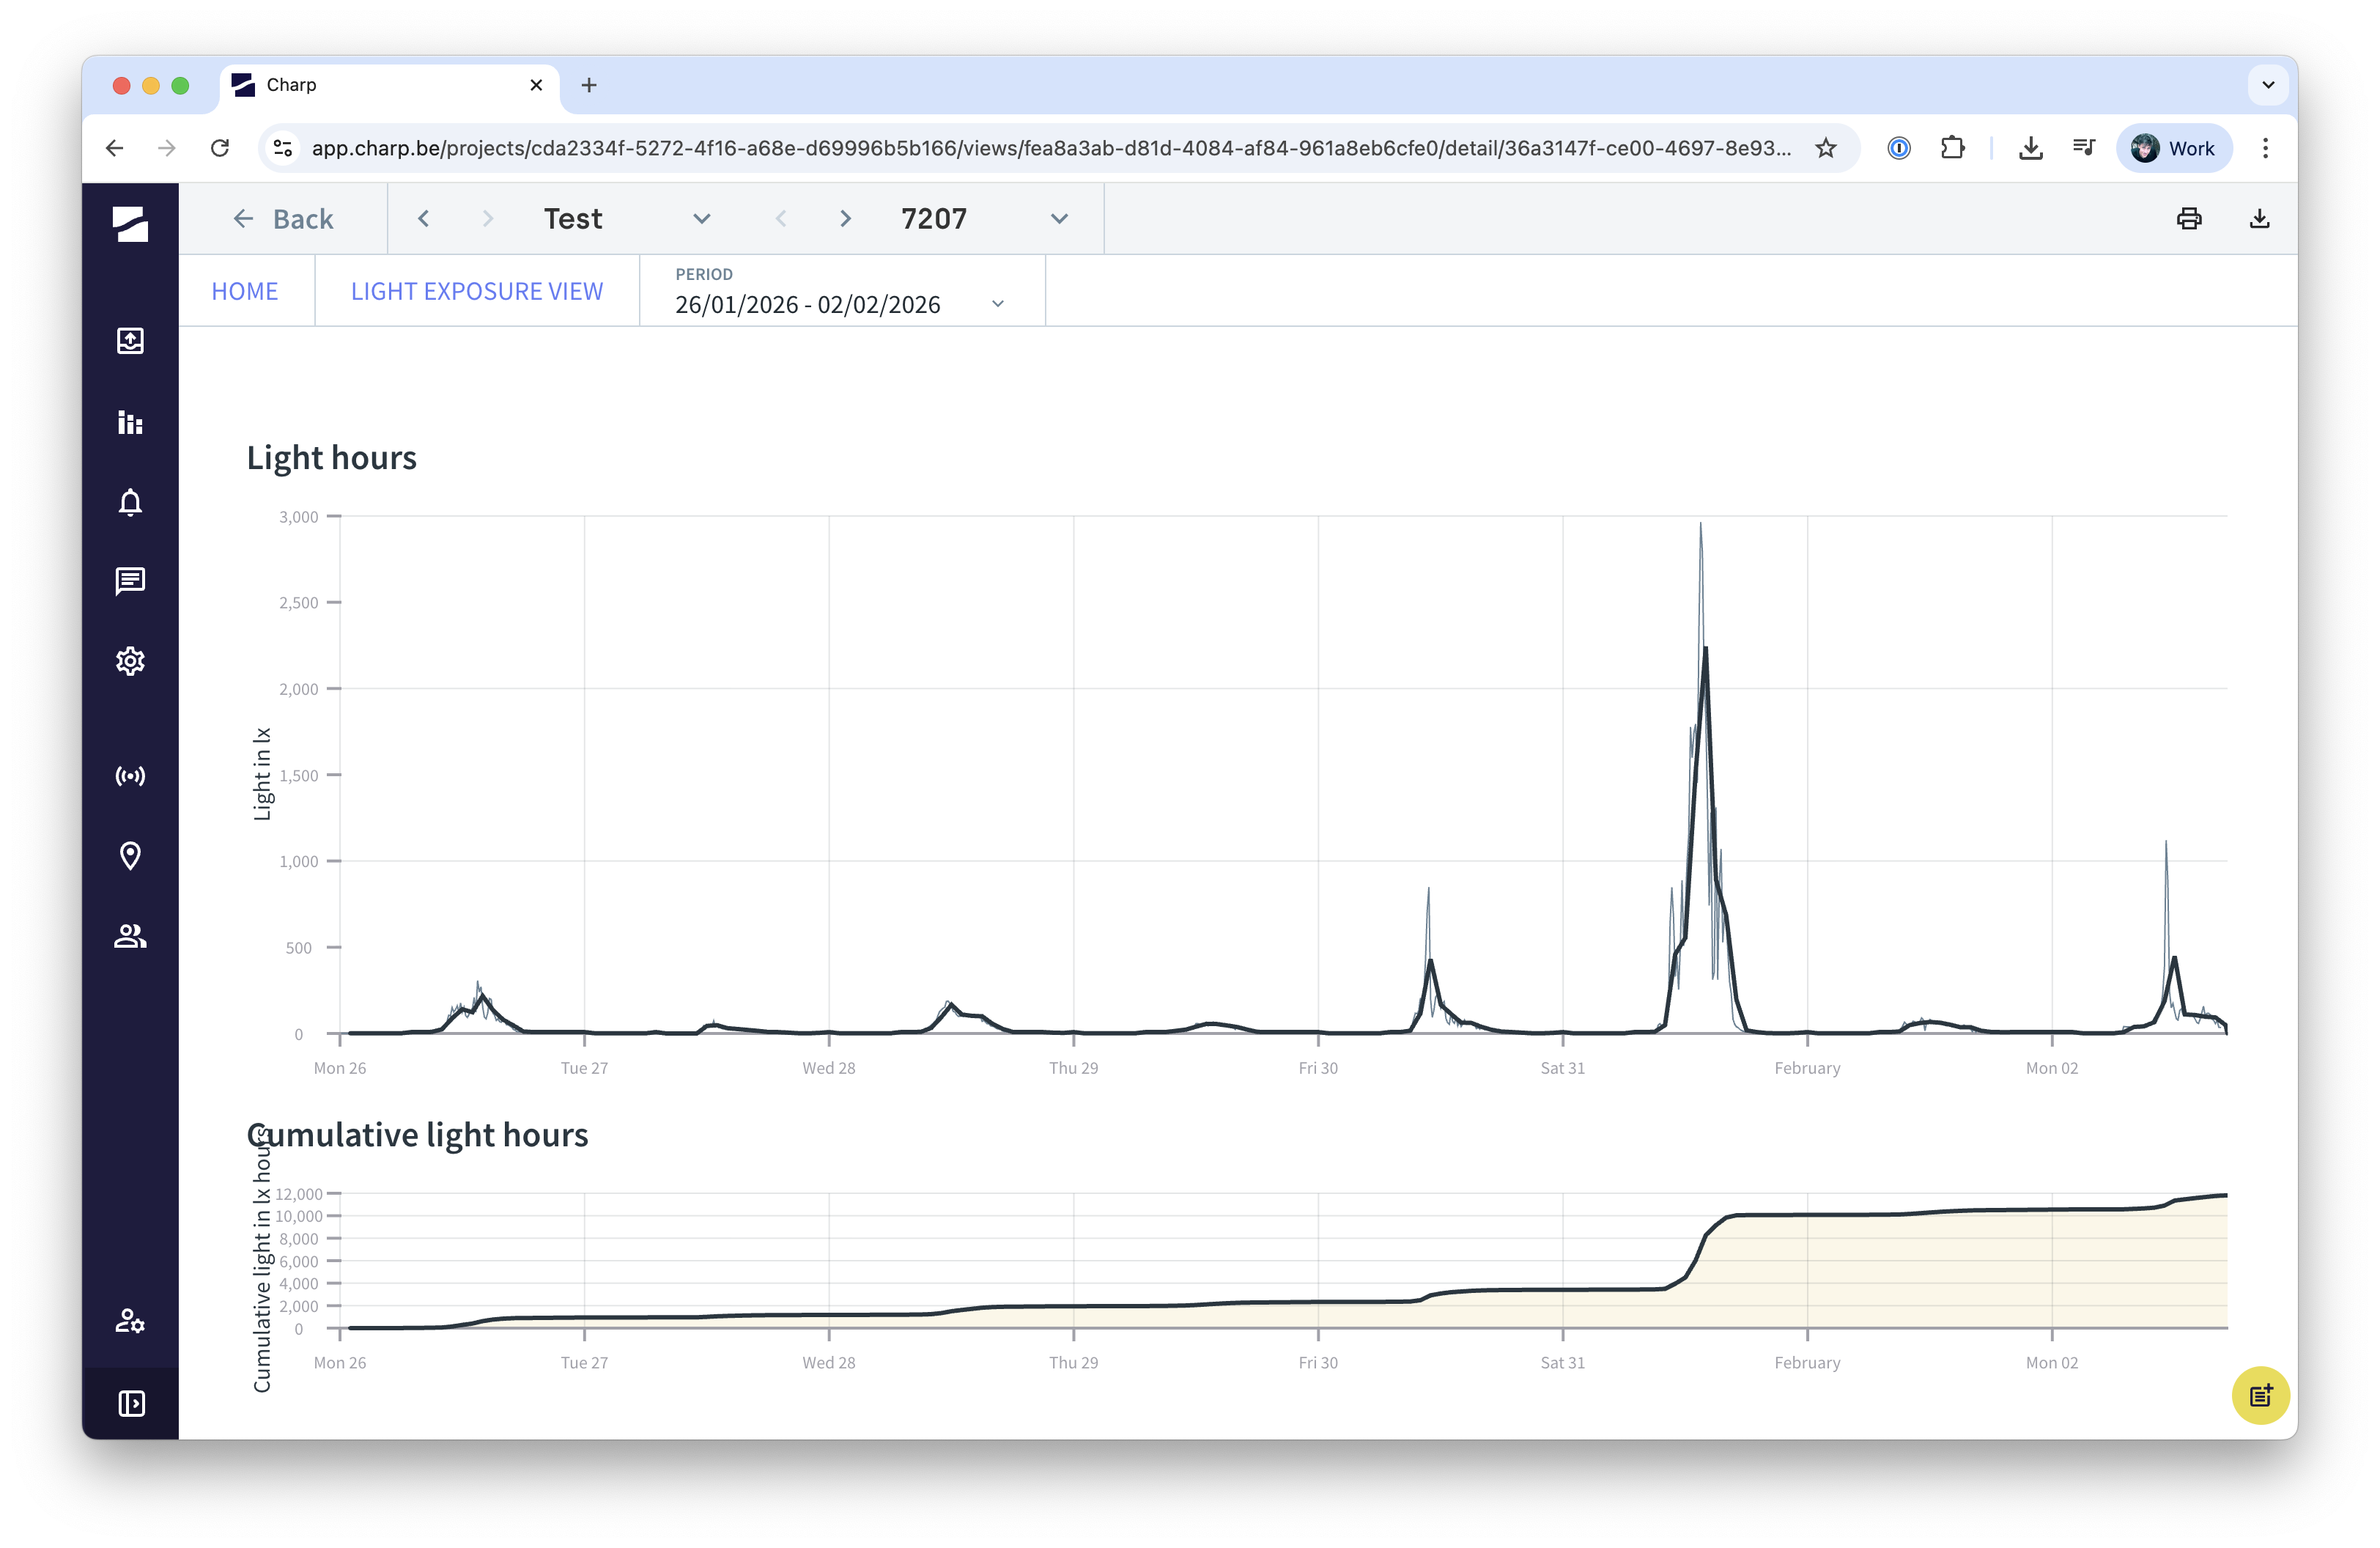
Click on any row in the table to open the detail view. Here, two stacked charts are displayed. The top chart visualises both the raw measurements in lux, and the hourly averaged lux values. The latter can be interpreted both as averaged values in lux, or equivalent luxhours. The bottom chart visualises the cumulative light exposure in luxhours over time. It begins its cumulative count starting at the beginning of the period selected at the top of the view.
Zoom in and out
In the detail view, zoom in by clicking and dragging across the chart. Double-click to reset the zoom.
Light budget view
The Light budget view compares the calculated cumulative light exposure against target thresholds based on the ISO Blue Wool scale.
View structure
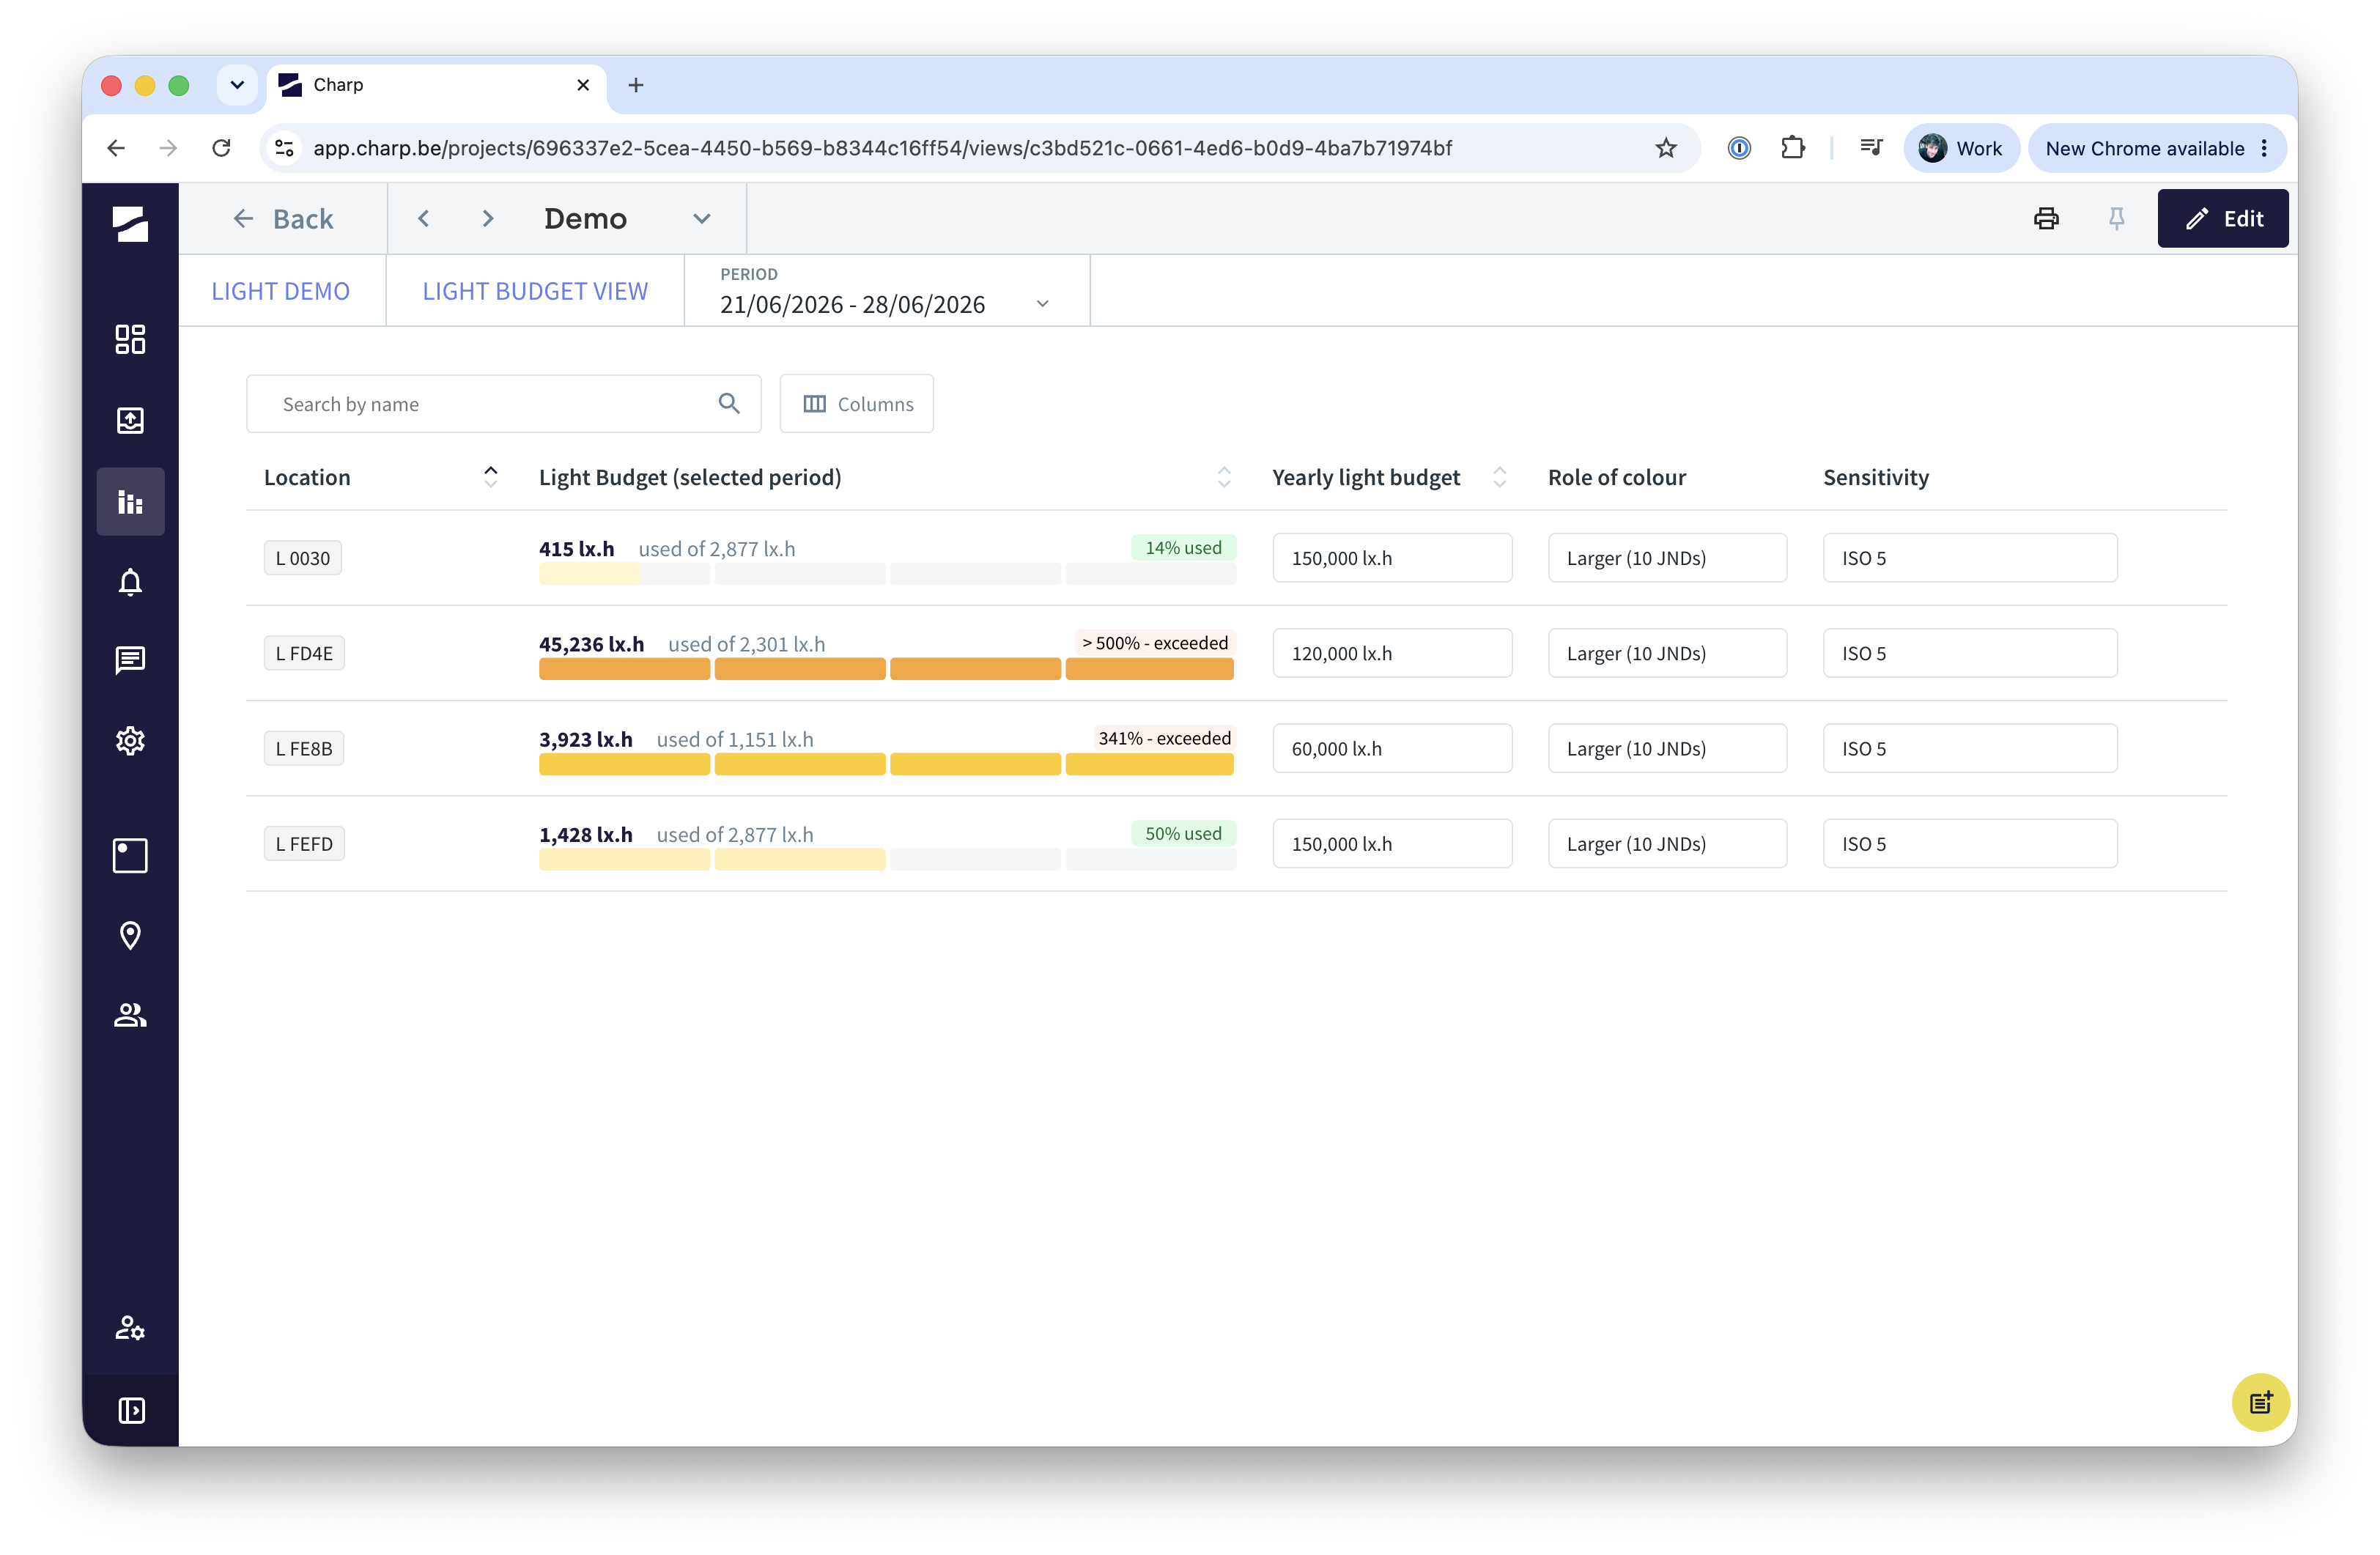
The Light budget view displays, for each selected location, a bullet chart evaluating the actual light exposure against the light budget. The bullet charts are divided into 4 equal parts, each representing 25% of the light budget. Each chart fills gradually as cumulative light exposure accumulates over the selected period. The yellow shade deepens as exposure approaches and then exceeds the light budget.
Above each chart, the cumulative light exposure is shown on the left and the percentage of budget used on the right. If the cumulative light exposure exceeds the budget, the chart is filled completely and the label "exceeded" is highlighted in red.
Parameters
When configuring a Light budget view, you define three key parameters:
- Yearly light budget, the cumulative light exposure in lux.hours (lx.h) allowed to fall on the object per year
- Role of colour, how important colour is to the object's significance, expressed in 10 to 20 JNDs (Just Noticeable Differences)
- Sensitivity, the material's light sensitivity according to the ISO Blue Wool scale (ISO 1 through ISO 8)
The light budget is calculated based on the parameters Yearly light budget, Role of colour, and Sensitivity, and is prorated to the selected period.
Light budget detail
Click on a location to open the detail view with more granular charts.
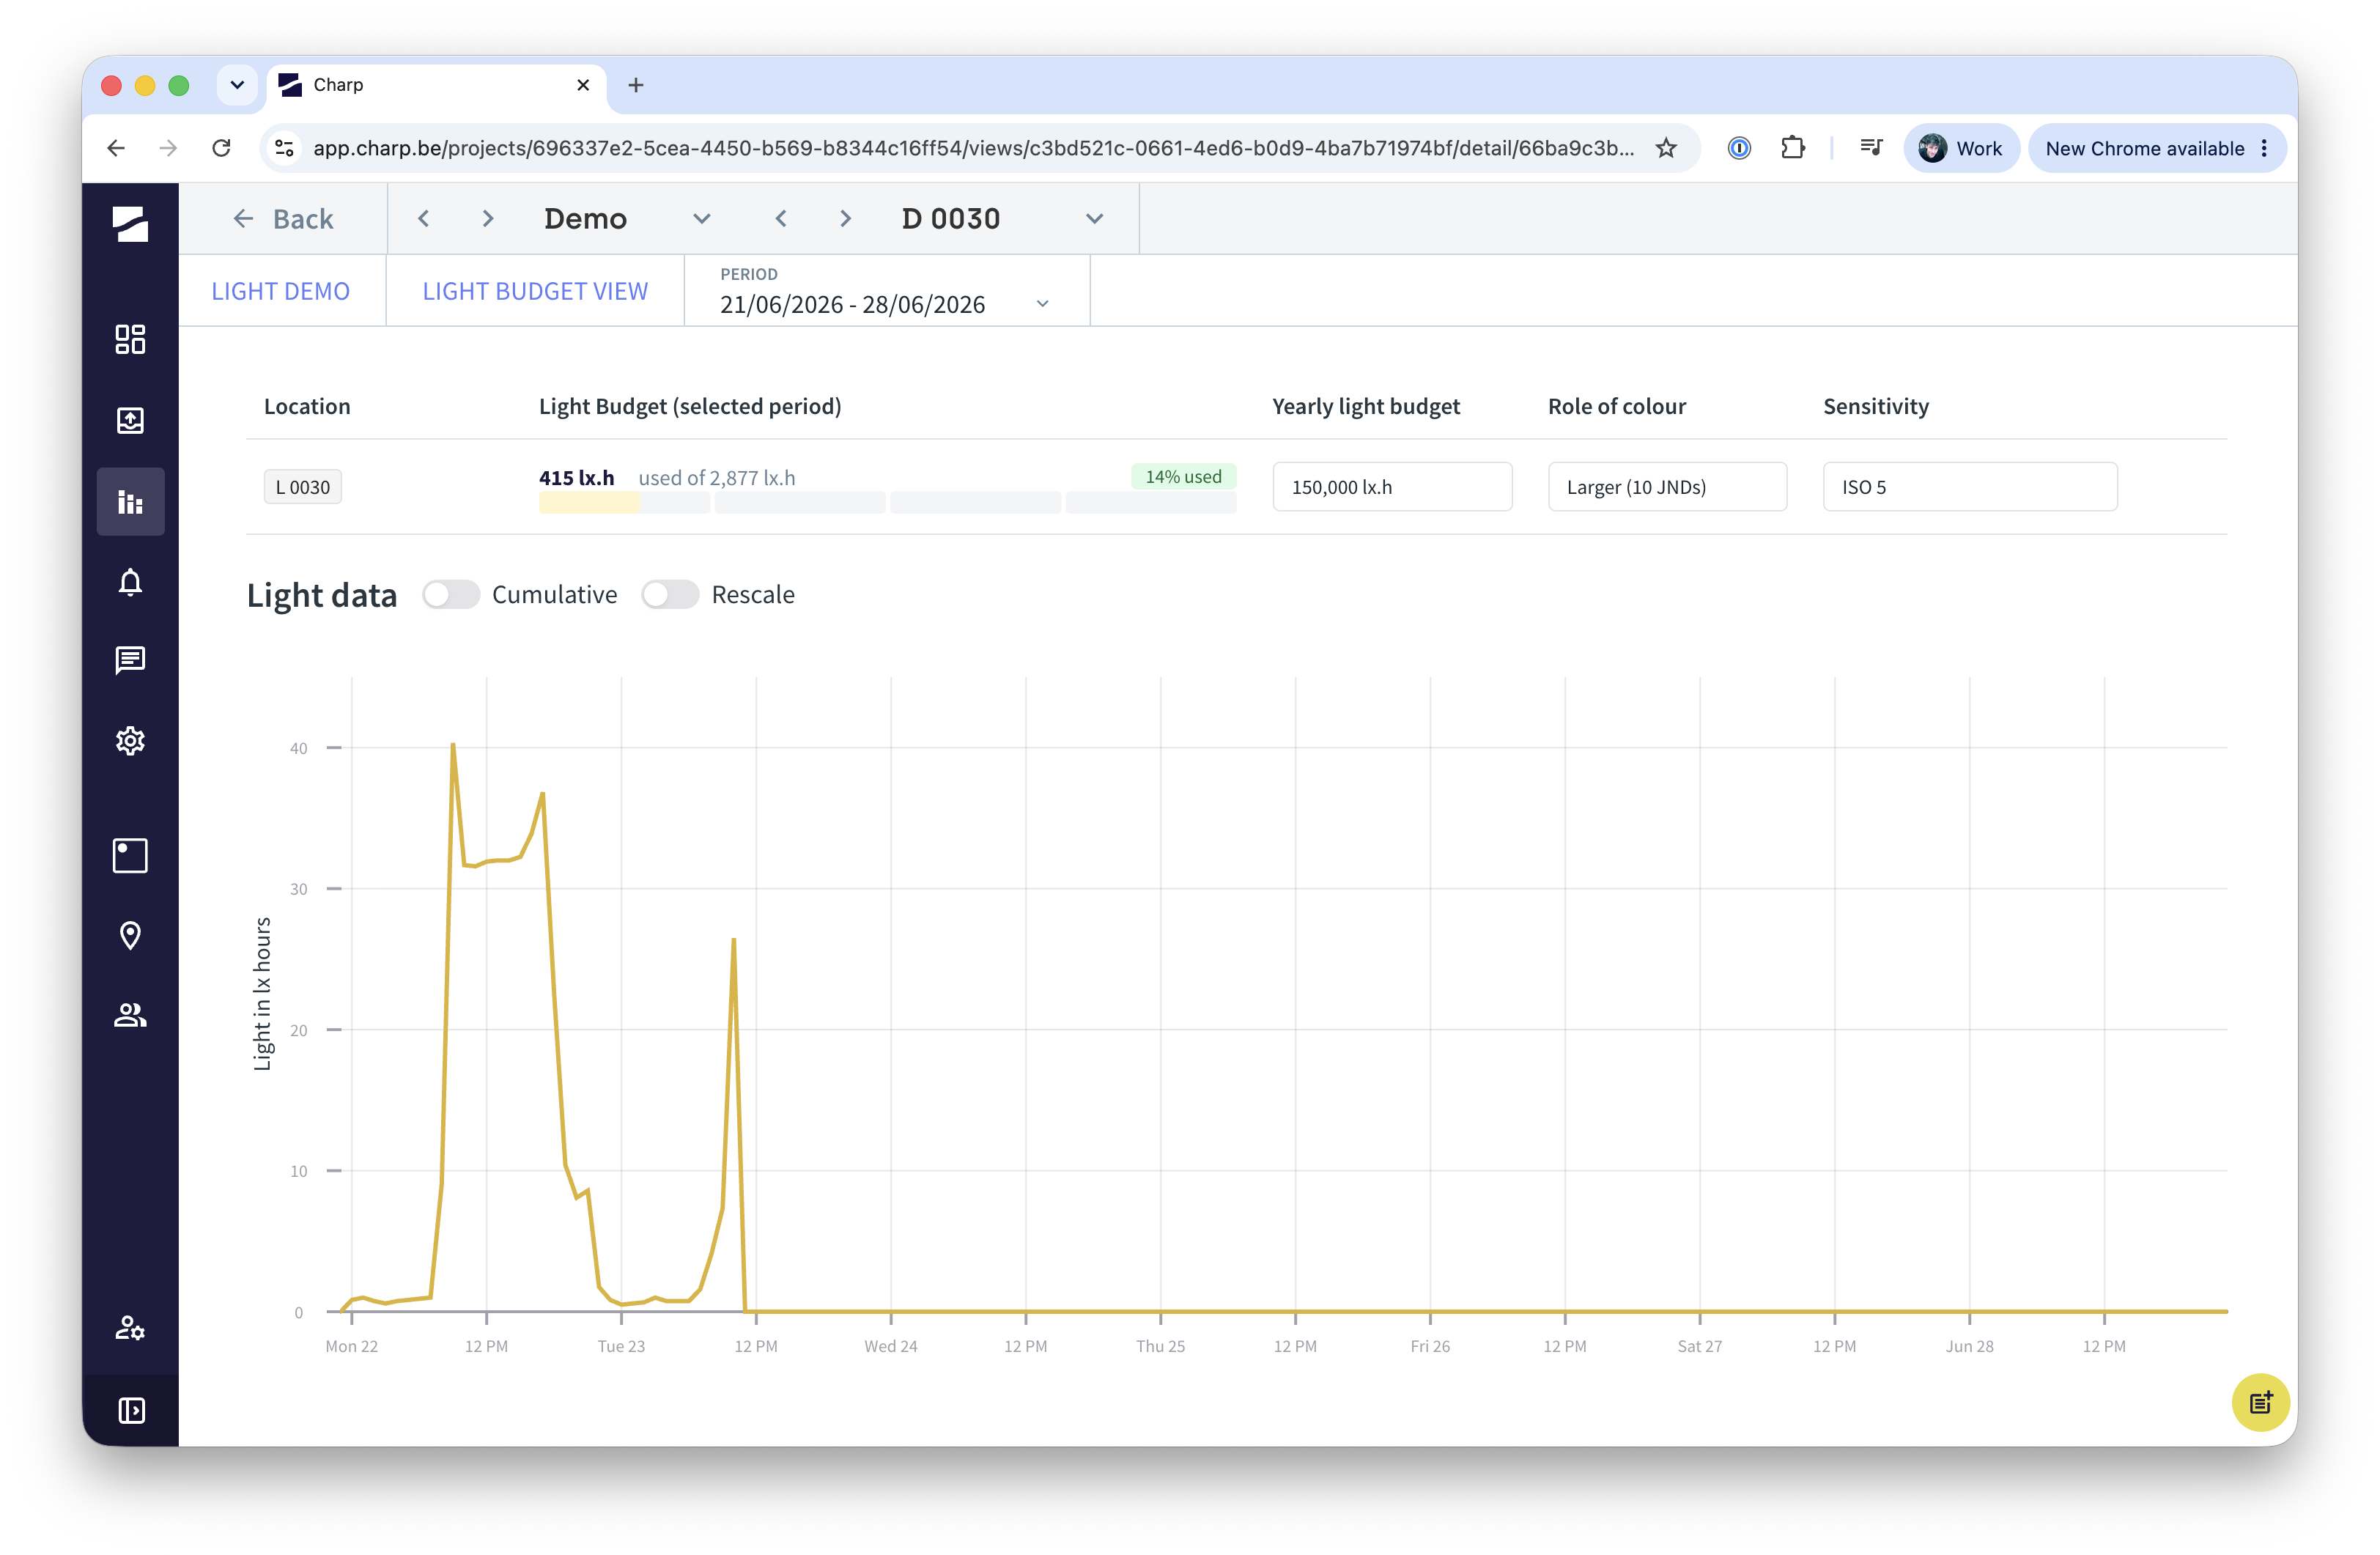
At the top, the bullet chart and selected parameters for that location remain visible. Below, a line chart shows the light readings in lux.hours (lx.h) used to calculate the cumulative light exposure. Just above the chart, there are two toggles: (1) to switch between cumulative and instantaneous light exposure levels, and (2) to rescale the chart.
The rescale toggle lets you explore how much the light exposure would need to increase or decrease to stay within budget. As you adjust the rescale percentage, the chart shows two lines — the original readings and the rescaled values — and the bullet chart and summary figures update accordingly. This makes it a planning tool, for example when designing the lighting of a future exhibition based on data from the current one.
ASHRAE 2019 view
To be completed.
Absolute humidity view
This view calculates and visualises the absolute humidity in g/m3 based on temperature and relative humidity measurements from the selected devices.
Dew point view
The Dew point view calculates and visualises the dew point temperature based on temperature and relative humidity measurements from the selected devices.
Why does dew point matter for preventive conservation?
Temperature and relative humidity are commonly monitored for preventive conservation. However, relative humidity depends on both the temperature and the absolute humidity in a space. By looking at the dew point, you gain insight into the actual moisture content of the air, which can help you better understand and optimise your collection climate. A rising dew point indicates increasing moisture levels, even if relative humidity appears stable due to concurrent temperature changes.