Dashboard
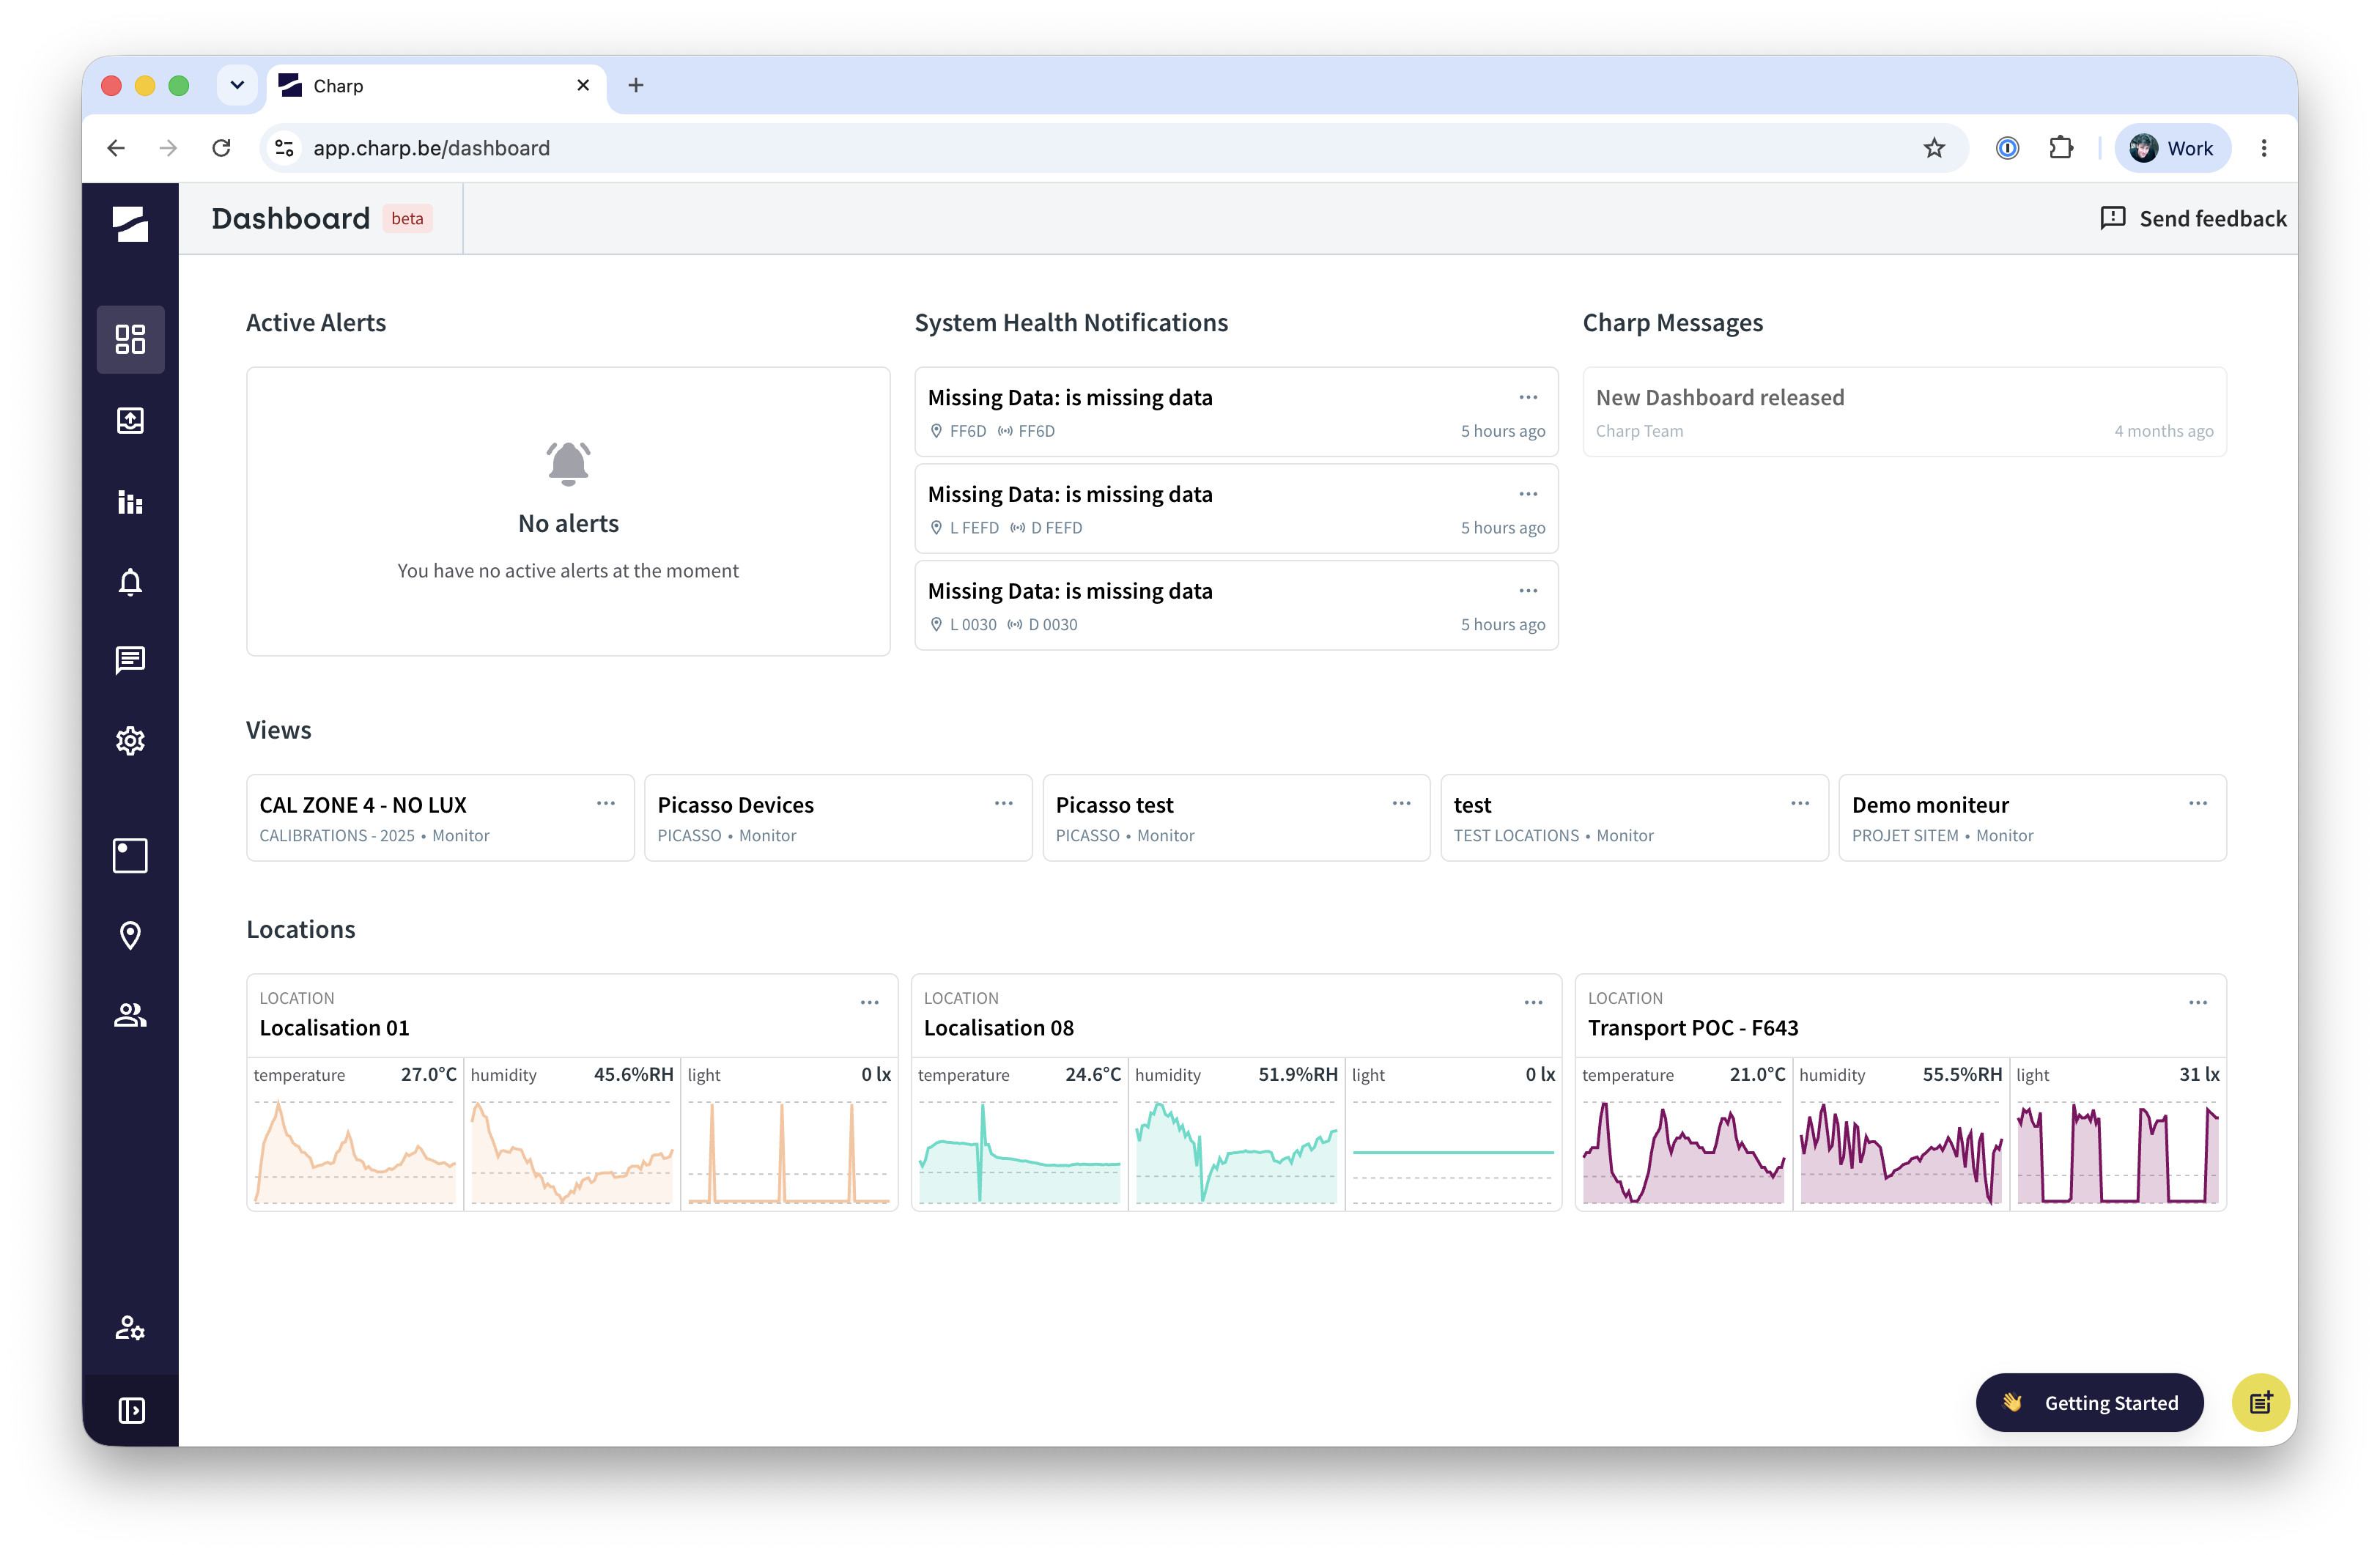
The Dashboard is the first page you see after logging in. It is built around the daily routine of collections care teams, giving everyone on the team an immediate overview of what requires attention, without having to navigate through individual views or locations first.
The Dashboard operates at organisation level. It highlights the current state of the collection environment across all locations: which locations are outside user-defined environmental thresholds, which loggers are reporting missing data, and which alerts are recent or still unacknowledged. In addition, it surfaces a configurable selection of pinned analyses and locations. For each pinned location, the Dashboard shows the most recent temperature, relative humidity, and light data over the last three days, so trends and anomalies are visible at a glance. Clicking any pinned view or location takes you directly to the full detail.
System administrators, typically the head of the conservation department and the facility manager, control which information is pinned to the Dashboard for the entire organisation.